How Quincy compares to other MA cities
Use the drop-down menu below to see how the 50 largest cities in Massachusetts compare on some financial indicators.
The data, the latest available from the Division of Local Services’ community snapshots, is from fiscal year 2024, with the following exceptions:
Debt data for Fall River, Haverhill, Holyoke, and Weymouth is from 2022
Spending for Holyoke is from 2023
Revenue data from Holyoke and Hudson is from 2023
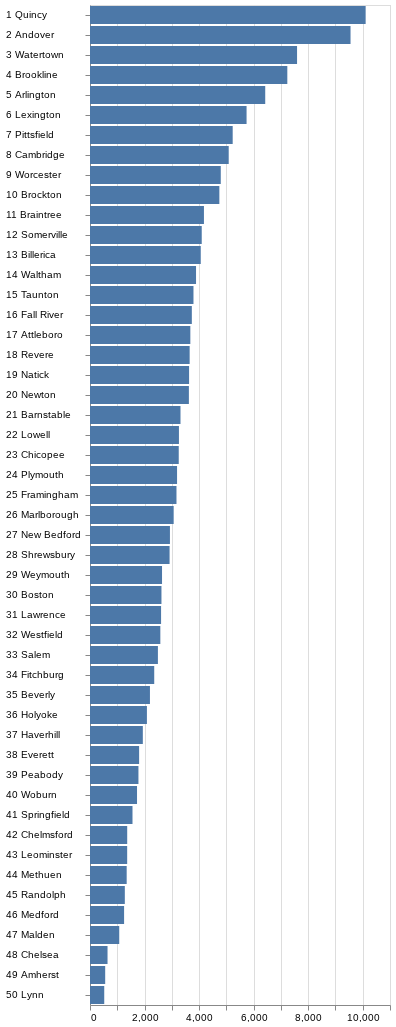
Debt comparisons (2024)
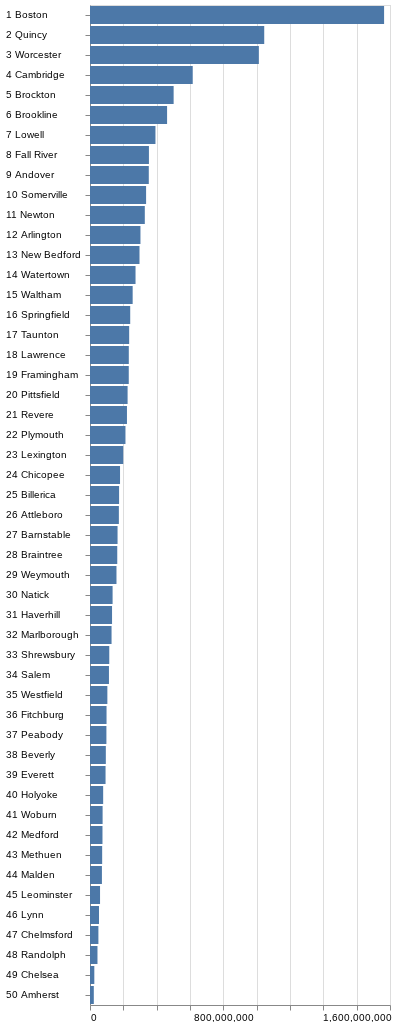
Total debt
This shows how much total debt each city carries
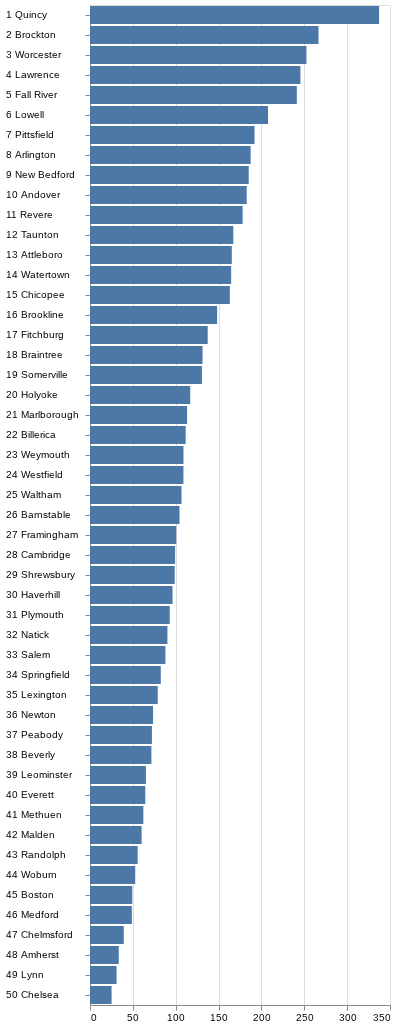
Total debt (% tax revenue)
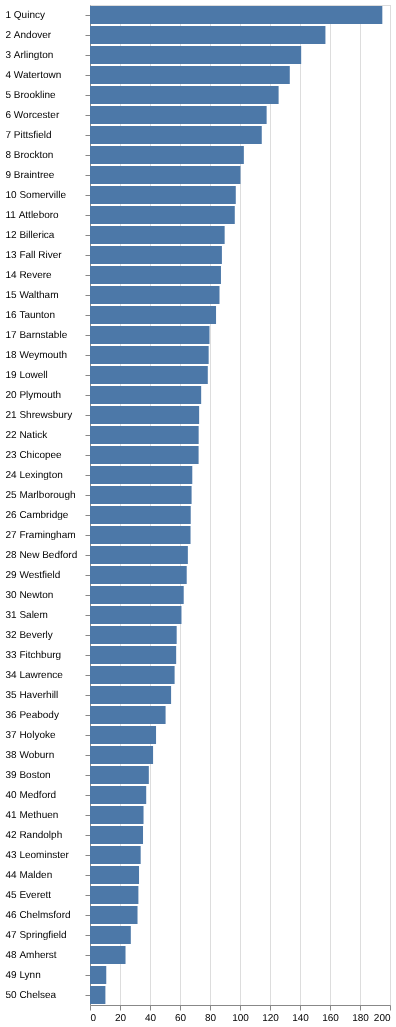
Total debt per capita
Quincy residents shoulder more city debt per person than the residents of any other large Massachusetts city
Total debt (% total revenue)